Youtube Data Manipulation
Motivation
Youtube is a constantly growing website with various contents and channels. It became a powerful medium for dreamers to share and deliver information through videos. Although I don’t post much on Youtube, I go on Youtube at least once a day either to listen to music or to find interesting videos. As one of the billion Youtube users, I thought it would be interesting to explore the data using Youtube API. Through this project, I first wanted to find trends in Youtube video searches and compare the patterns of each category, then subgroup the videos by days of week and weekdays/weekends. Also, I plan to create bigrams of titles to find which words are commonly used and possibly relate bigrams to the trend I find from categories and published days.
Programming
- Python
- JSON
Tools
- Jupyter Notebook
- APIs
- NLTK
- Pandas
- AWS
Data Sources
I mainly used two data different sources for this project. One from the Youtube API and documentation could be found here . I cached the output into JSON file by filtering those videos published from November 13, 2017 to March 21st, 2018, and limited to region ‘US’, so that it matches the excel file that I downloaded from Kaggle. The important variables that I extracted from this JSON file were title, publishedAt. The total datasets contain 550 records, which were for-looped 11 times because only 50 results are displayed per page.
Another data source that I used was a CSV file from Kaggle called USVideo.csv . This dataset contained videos published from November 13th, 2017 to March 21st, 2018, but there were a few odd datasets such as video from April 21st, 2017. Since most datasets consumed from November to March, I limited Youtube API to those timeframes. The variables that used from this dataset were title, published_time, category_id. This dataset contains 28350 records.
I had to use another dataset from Youtube API to find category names from category_id, so I cached another JSON file from Youtube API. This API, however, has a different documentation since it’s from video categories. This JSON file only contained 32 records because there are only 32 categories. The variables that I used are category_id and category names. I used this dataset as a reference to find category names and join them later using category_id.
Data Manipulation Methods
For the first dataset, I needed to collect data using the Youtube API. Thus, I cached the dataset so I can have consistency in the results. Then, I unnested the dataset using dictionary keys starting from ‘data’ to ‘items’ to ‘snippet.’ As I unnested this dataset, I constantly used pd.read_json() to convert JSON file to pandas DataFrame and named it ‘data_yt’. For the second dataset, I uploaded USVideo.csv file on AWS S3 bucket and converted it to DataFrame using pd.DataFrame() and named it ‘df_Video’. Since this dataset was so large, I dropped unnecessary columns such as channel_title, thumbnail_link, description, etc.
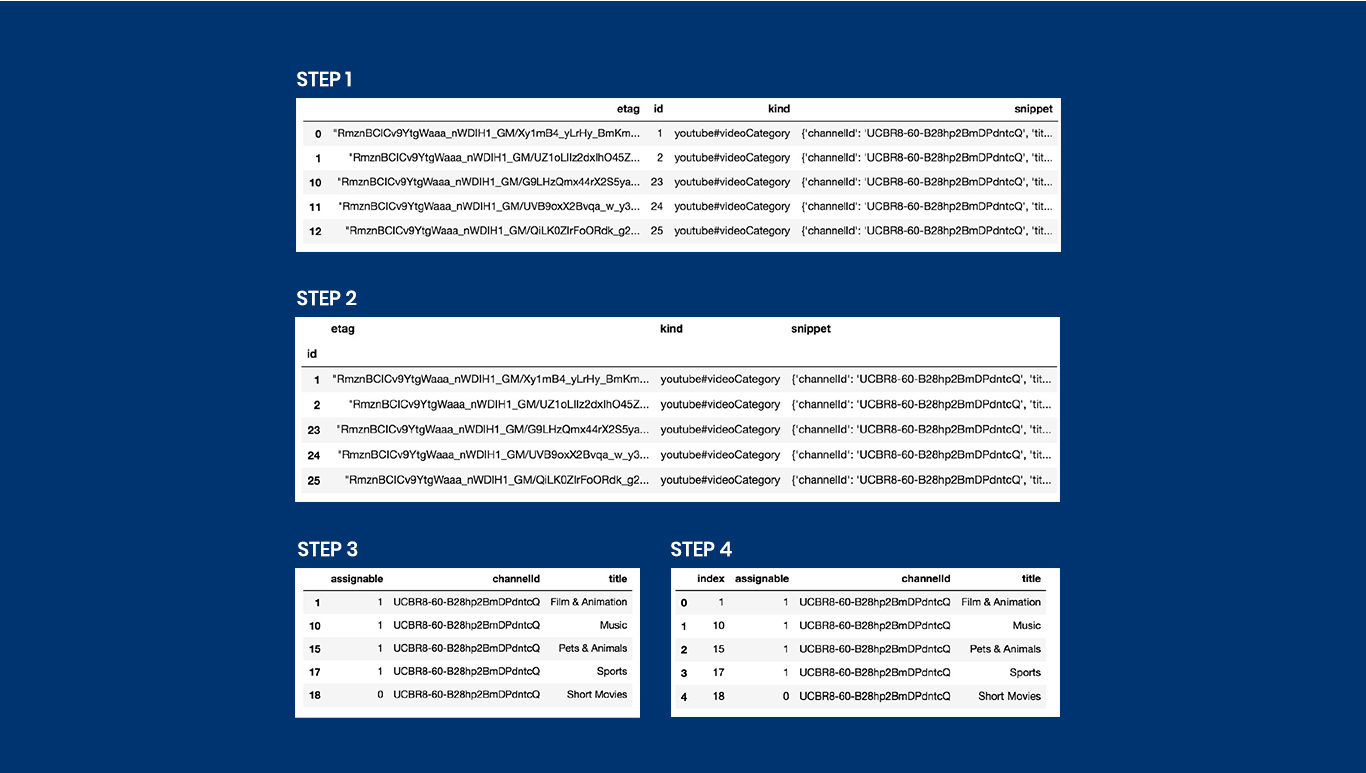
For the categories.json file that I cached as a reference for category names, I unnested the dataset similar to the dataset from Youtube API from ‘data’ to ‘items’ to ‘snippet’ and converted to a DataFrame named ‘categories’. After unnesting to get the categories, I changed the index to category_id by using set_index() to keep them and dropped the unnecessary columns. After just keeping category_id and category names, I renamed the columns and reset_index() to keep category names as one column instead of index.
After cleaning all the datasets, I concatenated two dataframes of USVideo.csv file and cached_youtube.json file and named the DataFrame ‘combined’ using pd.concat(). Because some of the record from cached_youtube.json didn’t have category_id, I dropped the null values from category_id columns by using dropna(). While concatenating two dataframes, the category_id’s changed to float instead of integer, so I converted the column back to integer since dataframe ‘categories’ has category_id as integer. I merged dataframes ‘combined’ and ‘categories’ on the variable ‘category_id’ using merge(). Then, I combined all columns that have different names but contain the same values. After combining all the columns, I dropped unnecessary columns and extra columns after combining them and renamed the remaining columns to be easily read.
Lastly, I parsed column ‘publish_time’ to create column ‘days’ to find the days of the week of video’s published time by using dateutil.parser and strftime(). After creating the column ‘days,’ I created another column called ‘weekdays/weekends’ to categorize the days of the week from ‘days’ using for loop.
Most manipulation was cleaning the data and extracting the necessary columns. I’veconstantly printed out head() for each dataset to check whether the datasets were cleaned enough and easily readable. The main parts consisted of converting the datasets to dataframes, merging and concatenating the dataframes, combining the columns, renaming the columns, and adding new columns. One of the challenges that I faced was during unnesting dataframes. When I was unnesting categories.json file, it was difficult to keep both category_id and unnest ‘snippet’, thus I made ‘category_id’ to index and unnested ‘snippet.’ After I unnested it, I reset the index and made ‘category_id’ to a column and renamed the columns. I’ve attached 4 screenshots of dataframes to show the process of unnesting and changing indexes.
Analysis
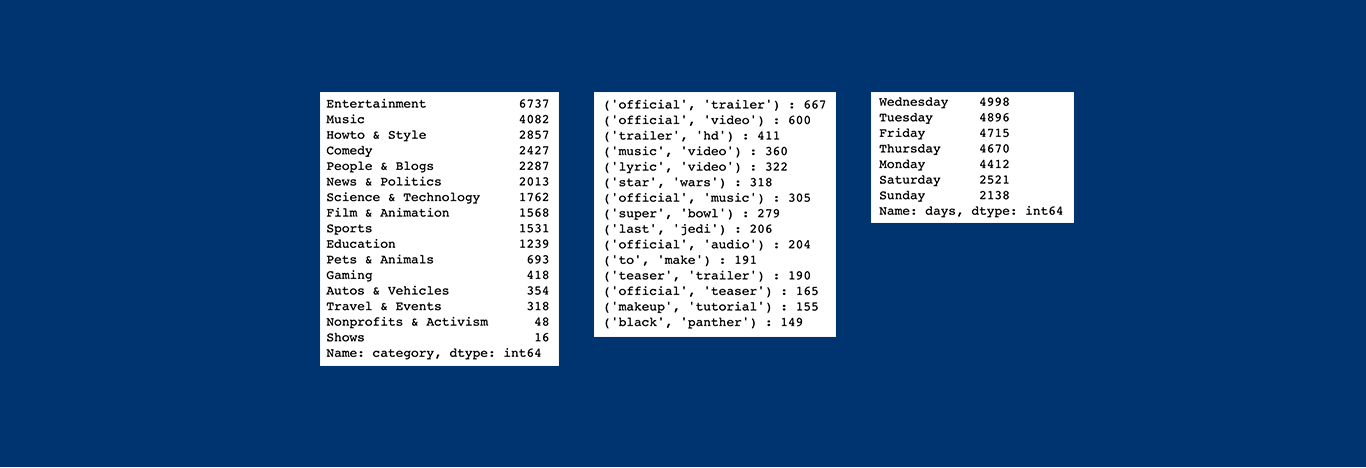
First analysis that I’ve done was creating bigrams out of titles. By using regex, I extracted the alphabets and normalized the titles. I split titles to words, removed the stopwords, and created bigrams using NLTK. Then I sorted bigrams on counts and printed out top 15 bigrams along with their counts.
Through this top 15 bigrams list, I realized that most titles are regarding trailers and teasers whether the videos are about movies or music. The word ‘official’ is very commonly used in video titles. The two movies that seem to pop out during the timeframe are Star Wars: The Last Jedi and Black Panther . Because of the Super Bowl in February, the bigram of super and bowl are on the top list as well. Also, one of the interesting trend I found out other than movies and music is a trend of makeup. The trend of makeup seems to be growing and the number of youtubers regarding beauty is becoming larger.
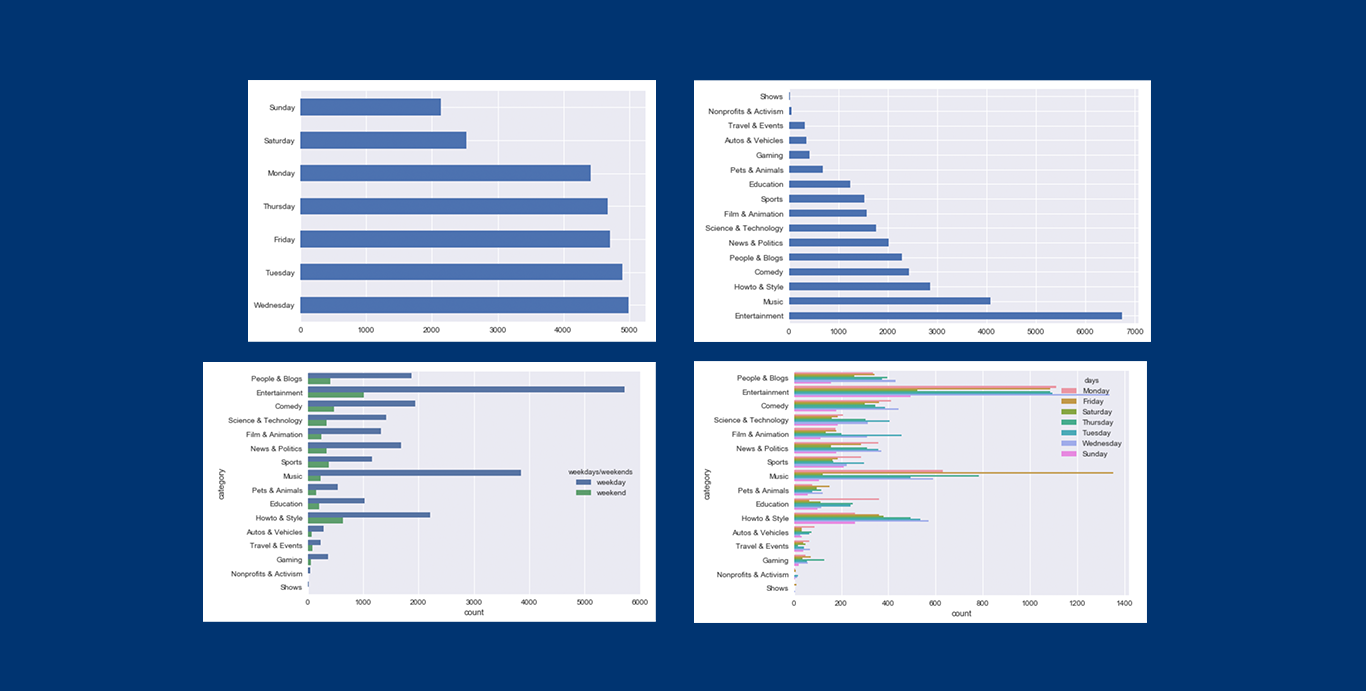
Another analysis I’ve done is creating bar graphs based on columns ‘categories’, ‘days of week’, and ‘weekdays/weekends’. As the bigrams showed, category Entertainment is the most used category followed by category Music. Surprisingly, the category Show isn’t used much even though I thought there were many tv shows that I’ve seen on youtube. The bar graph of days had surprising result. I thought more videos would be published over the weekend but most of them were posted on Wednesdays and Tuesdays. I think people publish videos in the middle of the weekdays since more people tend to stay home and use Youtube whereas they go out on weekends. In order to get more views, people target weekdays to publish videos than weekends.
By plotting bar graphs based on days of week and weekdays/weekends after grouping by categories, the trend seemed to be similar except for one. Most videos were published on Wednesdays but videos from category Music were mostly published on Fridays. I think music is published mainly on Friday, unlike other categories, because Friday is when people start their weekends. To start of their weekends, people play music to excite their emotions and search music to uplift their emotion on Fridays. Except for category Music, all categories were mainly published on weekdays, which was an insight I didn’t expect.
From the dataset of Youtube API, not all videos had the variable ‘category_id’ like the videos from USVideo.csv, so it was a little difficult to find those ids. I thought category was required in uploading videos on Youtube, but it doesn’t seem like they are, which made my trend finding study difficult. Other than that, I was able to find trends on Youtube Videos. More people posted on weekdays and popular categories were Music and Entertainment as the bar graphs and title bigrams showed. The bar graphs attached below are in order of bar graphs of value_counts() of days of week, video categories, and categories of subgroup days of week.